
ggplot用法多样,难以系统总结,要花大量精力。这里放一些个人的成功案例与代码,以后可以仿制。
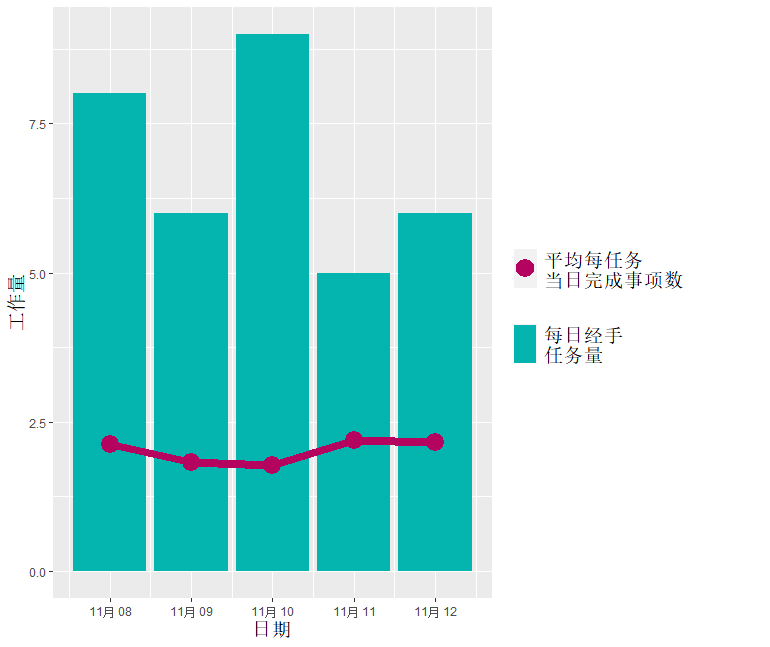
1 | ggplot(date_plot_df, aes(x = date, y = date_proj_num)) + |
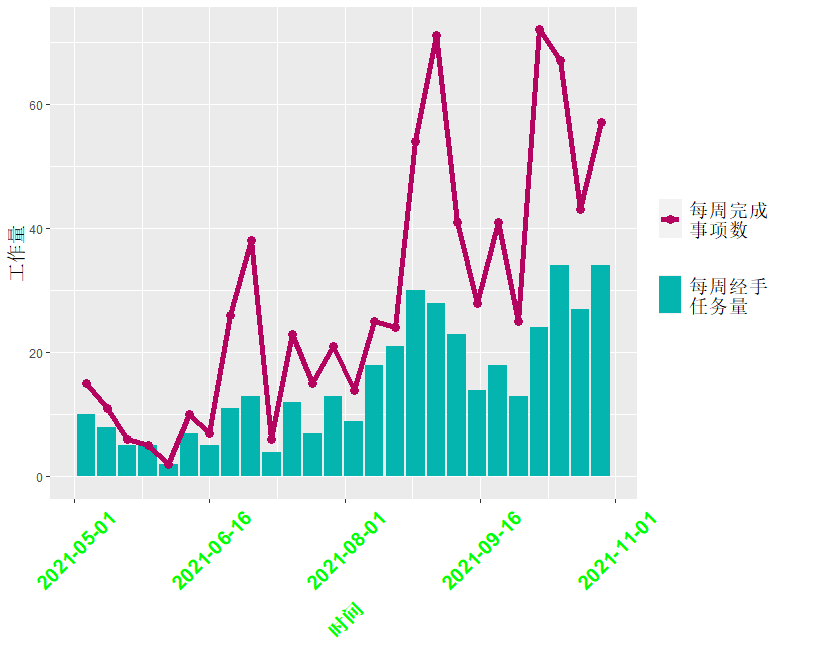
1 | ggplot(plot_df, aes(x = date, y = proj_num)) + |
PLOT_DF
| week_vec | start_point | end_point | proj_num | detail_num | week_id | bar_mark | point_mark | date |
|---|---|---|---|---|---|---|---|---|
| 1 | 44321 | 44327 | 10 | 15 | 1 | bar | point | 18752 |
| 2 | 44328 | 44334 | 8 | 11 | 2 | bar | point | 18759 |
| 3 | 44335 | 44341 | 5 | 6 | 3 | bar | point | 18766 |
| 4 | 44342 | 44348 | 5 | 5 | 4 | bar | point | 18773 |
| 5 | 44349 | 44355 | 2 | 2 | 5 | bar | point | 18780 |
| 6 | 44356 | 44362 | 7 | 10 | 6 | bar | point | 18787 |
| 7 | 44363 | 44369 | 5 | 7 | 7 | bar | point | 18794 |
| 8 | 44370 | 44376 | 11 | 26 | 8 | bar | point | 18801 |
| 9 | 44377 | 44383 | 13 | 38 | 9 | bar | point | 18808 |
| 10 | 44384 | 44390 | 4 | 6 | 10 | bar | point | 18815 |
| 11 | 44391 | 44397 | 12 | 23 | 11 | bar | point | 18822 |
| 12 | 44398 | 44404 | 7 | 15 | 12 | bar | point | 18829 |
| 13 | 44405 | 44411 | 13 | 21 | 13 | bar | point | 18836 |
| 14 | 44412 | 44418 | 9 | 14 | 14 | bar | point | 18843 |
| 15 | 44419 | 44425 | 18 | 25 | 15 | bar | point | 18850 |
| 16 | 44426 | 44432 | 21 | 24 | 16 | bar | point | 18857 |
| 17 | 44433 | 44439 | 30 | 54 | 17 | bar | point | 18864 |
| 18 | 44440 | 44446 | 28 | 71 | 18 | bar | point | 18871 |
| 19 | 44447 | 44453 | 23 | 41 | 19 | bar | point | 18878 |
| 20 | 44454 | 44460 | 14 | 28 | 20 | bar | point | 18885 |
| 21 | 44461 | 44467 | 18 | 41 | 21 | bar | point | 18892 |
| 22 | 44468 | 44474 | 13 | 25 | 22 | bar | point | 18899 |
| 23 | 44475 | 44481 | 24 | 72 | 23 | bar | point | 18906 |
| 24 | 44482 | 44488 | 34 | 67 | 24 | bar | point | 18913 |
| 25 | 44489 | 44495 | 27 | 43 | 25 | bar | point | 18920 |
| 26 | 44496 | 44502 | 34 | 57 | 26 | bar | point | 18927 |
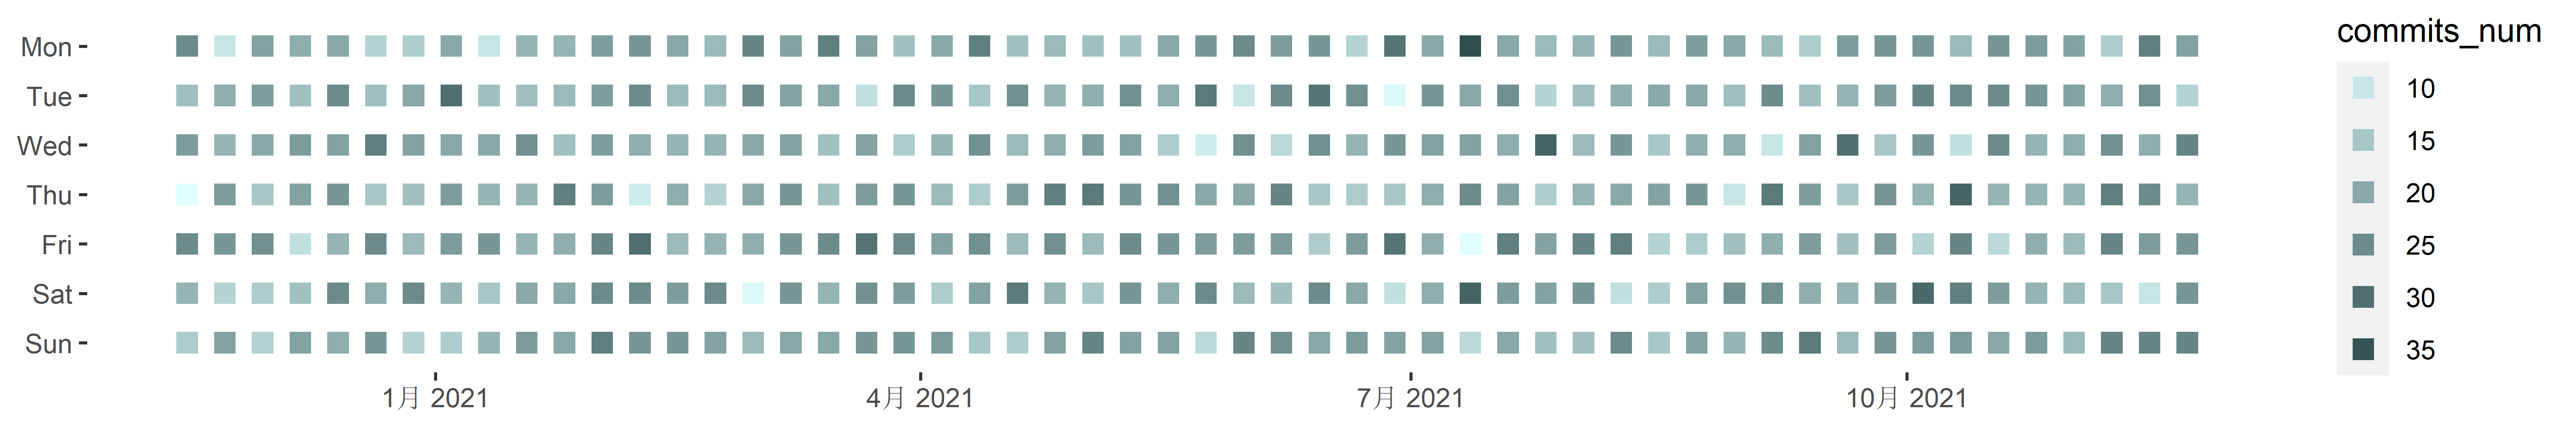
1 | ggplot(plot_df, aes(x = week_date, y = day_eng, color = commits)) + |
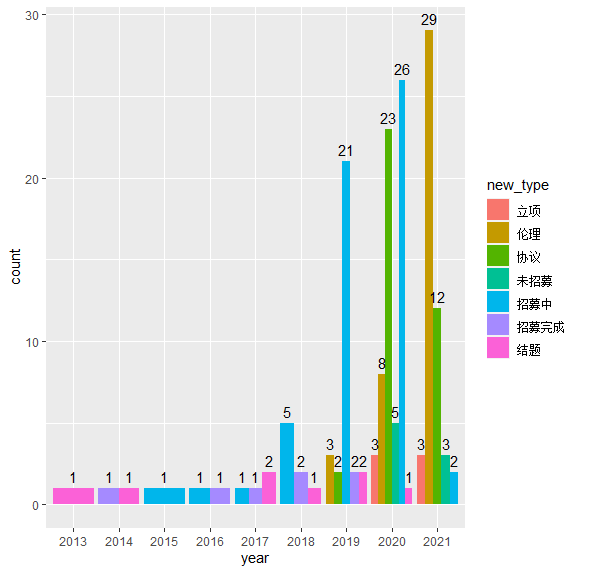
1 | ggplot(plot_df, aes(x = year, y = count, fill = new_type)) + geom_bar(stat = "identity", position = "dodge") + |