
Capstone Project for my MPH degree
Dynamic modeling analyses of Rubella in Henan Province, China, 2005 -2016
Author: Ruoyan Han 23831597 (MPH Student)
Capstone Advisor: Prof. Sheng Li, Prof. Mary Schooling
_City University of New York, Graduate School of Public Health and Health Policy_
Abstract
Background: Congenital rubella syndrome (CRS) is a severe disease for fetuses which is caused by maternal rubella infections. To prevent CRS, people need to have the antibody from vaccination or infections before adolescence. Studies indicate that small and remote areas may have a higher burden of CRS. Henan province is located at the geological center of China. It encompasses counties with very different population sizes and levels of economic development.
Methods: In this study, we identified attributes of counties in Henan province including the basic reproduction number (R0), critical community size and seasonality controlling for population size and local economic status using linear models.
Results: In Henan province, cities with larger population size is related with higher R0. And counties with small populations had more extinction periods of rubella and their basic reproduction numbers were lower. Rubella seasonal patterns are similar in different population sizes and economics levels.
Conclusion: Low population size and low per captita GDP of an area is related with lower rubella activity which could lead to a higher burden of CRS.
Introduction
Rubella, known as German Measles1, is a mild, viral infection among children and adults2. The rubella virus can only be carried by humans3. After infection, symptoms include fever, malaise, arthritis, and a rash over the entire body4,5. These symptoms disappear after a few weeks5. Once patients have recovered, they have lifelong immunity from rubella6.
However, if women get infected by the virus during pregnancy, the virus can reach the fetus through the mothers’ viremia and placental infection4. Rubella in the fetus can cause abnormalities in the fetus’ tissue and organs, with life-long effects on function, resulting in blindness, cardiovascular abnormalities or brain damage4, called congenital rubella syndrome (CRS).
The key point of preventing rubella infections is to eliminate the burden of CRS rather than total infections, unlike other infectious diseases7. To achieve this goal, the prevalence and incidence of rubella infection in pregnancy needs to be reduced. This is different from other infectious disease prevention policies that aim at reducing infections in every age group as much as possible. Low vaccination rates result in more people in the pregnancy age-group being susceptible to rubella compare with no vaccination at all3,8-11. In addition, in small population areas, the random extinction of rubella viruses occurs more frequently and lasts longer, which results in more susceptible women into the risk age group for CRS12. Previous studies in Peru12,13 and Mexico14 have shown that small, remote or rural areas are more vulnerable to random extinction of the rubella virus, which could make the burden of CRS more severe. However, whether the same happens in other different countries or populations is unclear.
Henan is located in the center region of China. With a permanent resident population of about 100 million, it is one of the most populous and densely populated provinces in China. As the crossroads of the two main railway lines in China, Henan is also one of the largest transportation hubs in China. Similar to other western pacific countries China has a relatively low burden of rubella and CRS15-18. Since 1995, the Chinese government has been implementing a rubella control program. At that time, 2 doses of liquid monovalent rubella vaccine were used in 8 - 10 months babies and 7 - 12 years children. From 2008, the strategy was changed to 1 dose of measles-rubella (MR) combined vaccine in babies at around 8 months and 1 dose of measles-mumps-rubella (MMR) combined vaccine in 18 - 24 months babies. However, Henan province stared to use MMR as the second dose in 2011. In addition, there is another key factor relevant to the spread of infectious diseases, i.e., the numbers of newborn infants. The one-child policy, which suggests family only give born to one baby, had been in operation in China since 1979 and relaxed in 201419.
In this study, we will use three factors, the basic reproductive number R0, the critical community size, and seasonality, to describe the dynamics rubella and CRS in Henan province and then assessed how population size and per capita gross domestic product (GDP) influenced these dynamics by modeling different values.
Method
Data
Data used in this study was provided by the Center for Disease Control and Prevention of Henan Province, China. The data includes biweekly new cases of rubella by age group by county from 2005 to 2016 for the 159 counties, which can be aggregated in different ways, for example by age or into the 18 cities. The annual population and total GDP of counties and the number of births by cities during the same period are also provided. Per capita GDP is calculated as total GDP divided by the population size. County population size and per capita GDP were categorized relative to the median for Henan.
In some of the following analyses, we transformed the different values of these two covariates of each location (city or county) to a permanent characteristic. For example, counties whose mean population size of the study period is over the median of the mean population size of all counties are called “Larger Population County”. Similarly, properties like “Smaller Population”, “Richer”, “Poorer” are generated for each county and city. In this way, data modeling will be simpler.
Relationship between per capita GDP and population size
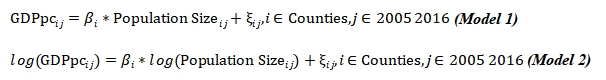
Given we considered both per capita GDP and population size as relevant to the dynamics of rubella viruses and CRS, we checked the distributions and co-linearity for the two covariates. Since population size and GDP per year in one county are not independent of measurements from another county. A fixed-effect model was used to explore the association between the two variables. Specifically, linear regression with county ID as covariates:
Basic Reproduction Number, R0
The reproduction number (R0) is the number of susceptible people on average infected by one infected person. It is a measure of the transmission ability of an infectious disease. In vaccinated populations, the actual reproduction number (Rt), can be much lower than R0. R0 could be roughly calculated by the inverse of per capita birth rate (G) divided by the mean age (A) of the infected cases20. It is a ratio of two different time lengths: time that on average generate an infant and time that on average generate a new case. The mean age of infection is defined as the inverse of the incidence rate each year plus the inverse of the length of maternal immunity, which is roughly measured by the inverse incidence of rate each year in this case. Under this strategy, this number is equal to the actual average age of the cases each year.
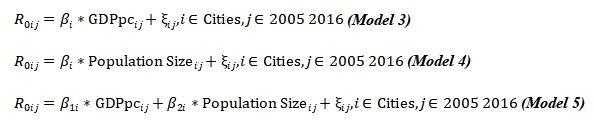
We assessed the relation of city size and per capita GDP status with R0 by year. Since each city has different R0 in different years, single cross-sectional model cannot handle this longitudinal measurement. In this analysis, we suggested that all cities have a unique intercept for each cluster. Therefore, we used general least square models to fit the data:
Critical Community Size
Critical community size is the smallest population size where the infectious disease exists permanently without random extinction21. Extinction is defined as no cases in one bi-weekly time unit. We fitted the regression model to describe the relationship between the population size random extinction proportion using regression adjusted for relative GDP. The model is shown below:

Population size is the interested variable in this test. This model will tell us whether the pattern that areas with smaller populations have more extinction proportion, and whether per capita GDP influences this relationship as a confounder and effect measure modifier.
Seasonality
Timing of annual peak(s) or varying frequency of rubella outbreaks can also influence virus transmission, especially among children who usually have regular school schedules22-24. We plotted case numbers by fortnights to see whether the outbreaks occur at approximately the same time of year and whether the frequency of the wave is stable during the study period.
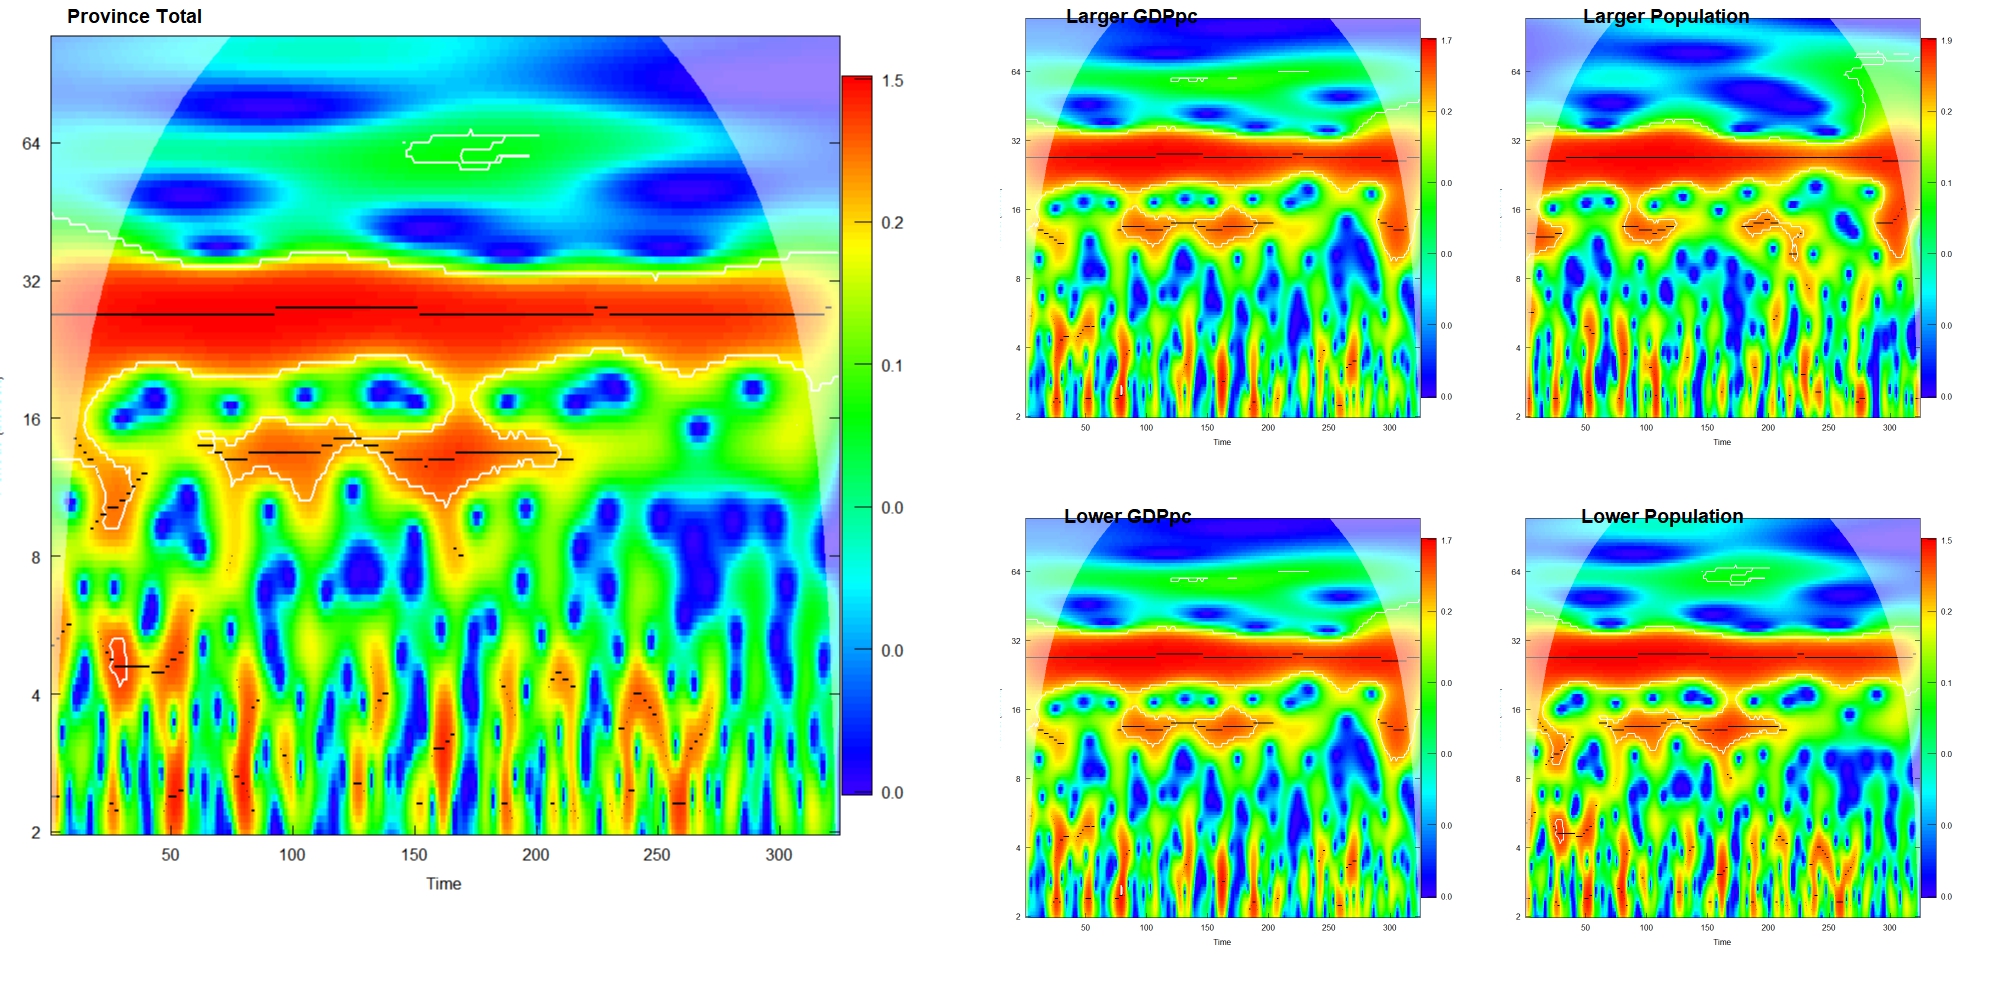
Wavelet analysis is an approach to unfold frequencies composition of complex waves. Same with Fourier transform, dot products of an orthogonal basis, which is a simple wave signal, and the original wave at different time points and different frequencies of the orthogonal are expressed. Compare with Fourier transform or short period Fourier transform, this approach is better for disease cases curves, because there could be randomly arising that won’t appear regularly or permanently in the rubella curve.
We assessed the frequencies of the outbreaks and epidemics by province and county using the wavelet analysis. The input of the wavelet analysis was the log of the biweekly case numbers based on 10 and we chose Morlet wavelet as the orthogonal basis in the analysis because the Morlet wavelet is the most similar one to the rubella waves’ form. Since the analysis cannot handle value lower than 0, for the points whose log case numbers are lower than 1, we changed it to 1. This operation won’t change the result of wavelet analysis a lot since the points we added to one are the bottom of the wave while the approach focuses on the peaks of the wave.
Tools of Analysis
All analysis in this study was finished in R software 3.6.3. Packages used in this study for data processing, model fitting and plots generating are dplyr25, devtools26, magick, cowplot27, ggpubr, nlme28, xlsx29, ggplot230, WaveletComp31, stargazer32, sf.
Results
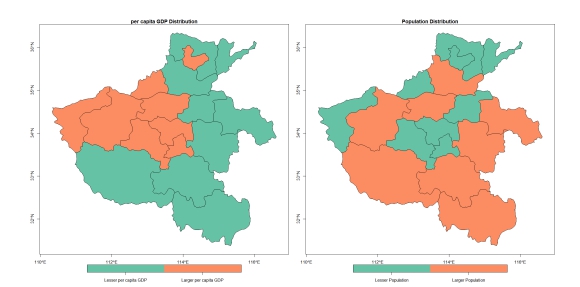
Relationship between per capita GDP and population size
Three results are provided to show the relationship between population size and per capita GDP. The first one is the regression to test the relationship (Table 1.). Log per capita GDP and log population size were not statistically significantly related. The second one is the range of the per capita GDP and population size. The mean of the range of per capita GDP for each county: (1.30, 5.51), the same range of population size: (559611.6, 641956.1). The range of population size is 20,000 times of the range of the per capita GDP, which is much larger than the parameter estimated in Table 1.
Table 1. Relation of log per capita GDP with population size (using linear regression)
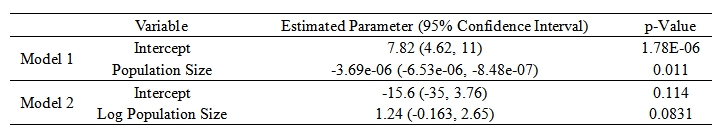
We also transformed the two variables to dichotomous categories for each county depend on whether they are higher or lower than the median of the measurements. We calculated the odds ratio between the two dichotomous variables and the result shows that the odds of being an area where per capita GDP higher than the median, among areas where population size is lower than the median, is 4.67(95% CI: 2.42, 9.26) times of the odds among areas where population size is larger than the median.
Binary Variable Transforming
In order to have a straighter modeling which could be easier to interpret and understand. In some of the following analysis, we transformed variables population size and per capita GDP to binary variable by judging whether the mean measurement among research time period of one location is larger than the median of all locations. We marked locations as lesser (or larger) population size (or per capita GDP).
Basic Reproduction Number, R0
Figure 2 shows the R0 values by city by year with different population size or per capita GDP. By visual observation, counties with larger population are also have larger and more unstable R0 values. R0 do not have obvious different among cities with different per capita GDP.
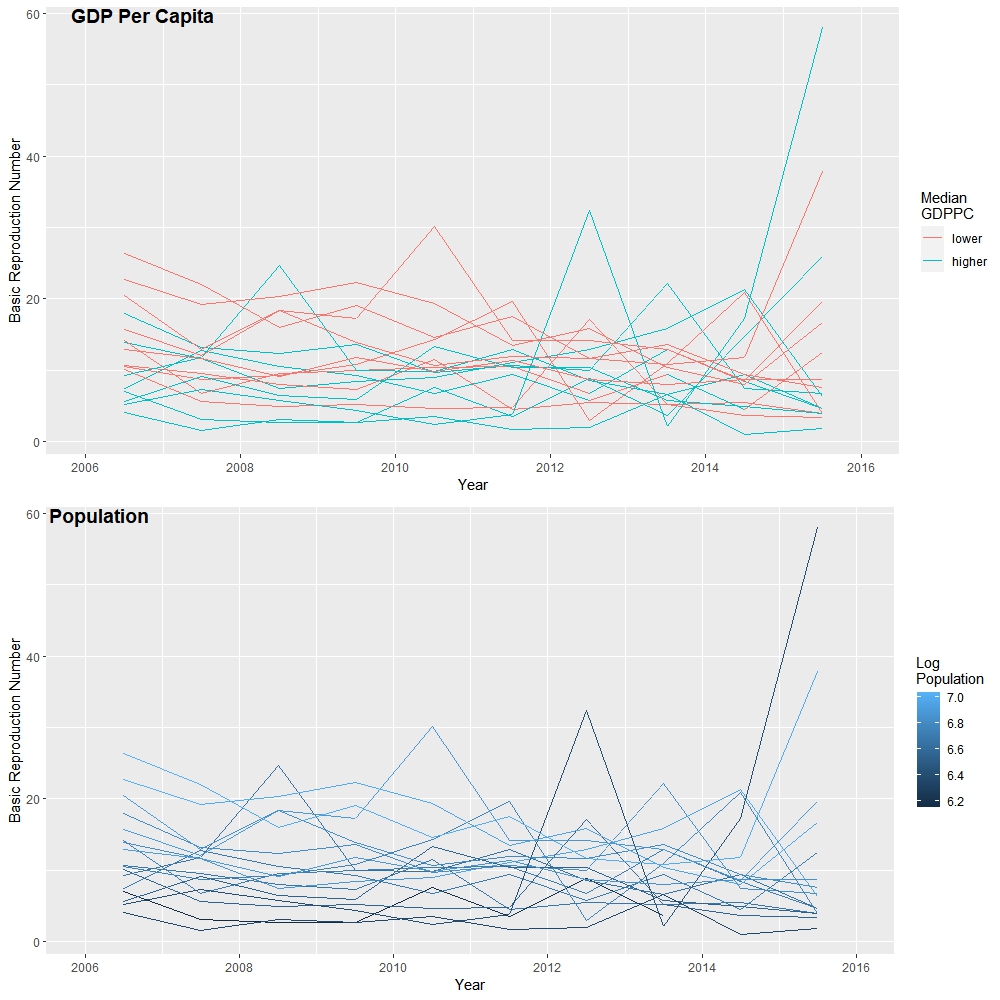
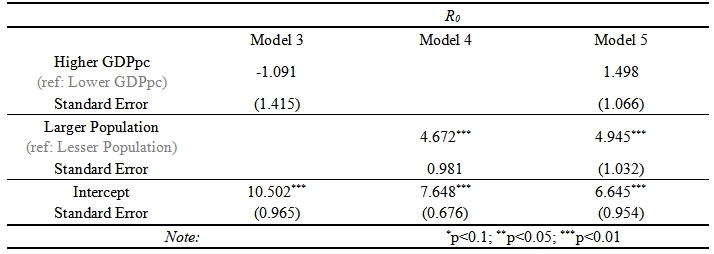
Table 2 shows that the association of the GDP, population size and their mixed model with R0, which is a statistical examination of the visual conclusion from Figure 2. From this result, population size was statistically related with R0. Per capita GDP was not statistically related with R0.
Table 2. Association Between Basic Reproduction Number and Local Economics and Population Statuses
Critical Community Size
The following table and plot are showing results of whether the relationship between random extinction of the cases and the log of population size is confounded or modified by the per capita GDP status of the local area.
Table 3. Relationship Between Extinction Proportion and Population Sized, Controlling for Per-Capital GDP
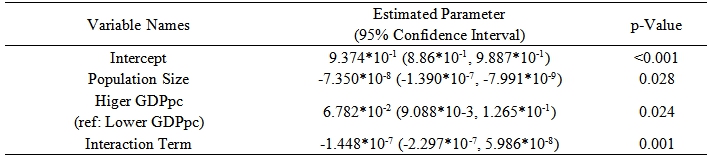
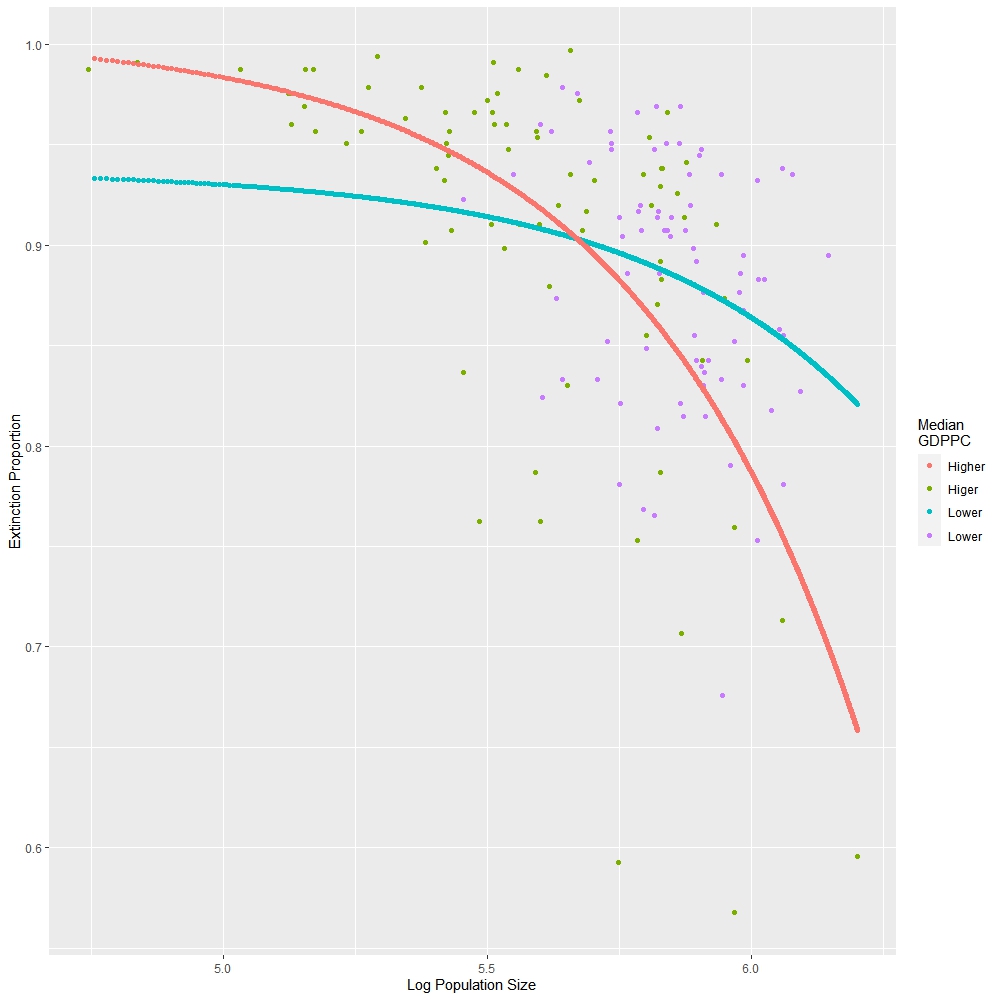
The result indicate that population size is linear negatively related with extinction proportion of rubella virus. The larger population would have lesser time period that there is no rubella virus hosted in people. Moreover, whether the per capita GDP is higher that the median of the province also significantly related with both the intercept and slope of the estimated relationship. In areas that per capita GDP is higher, the critical community size is estimated as 4.605*106 while in areas whose per capita GDP is lower than the median, the estimated critical community size is 1.275*107.
Seasonality Analysis
An annual case line for the whole province is generated to directly show whether frequencies of the outbreaks and epidemics are stable.
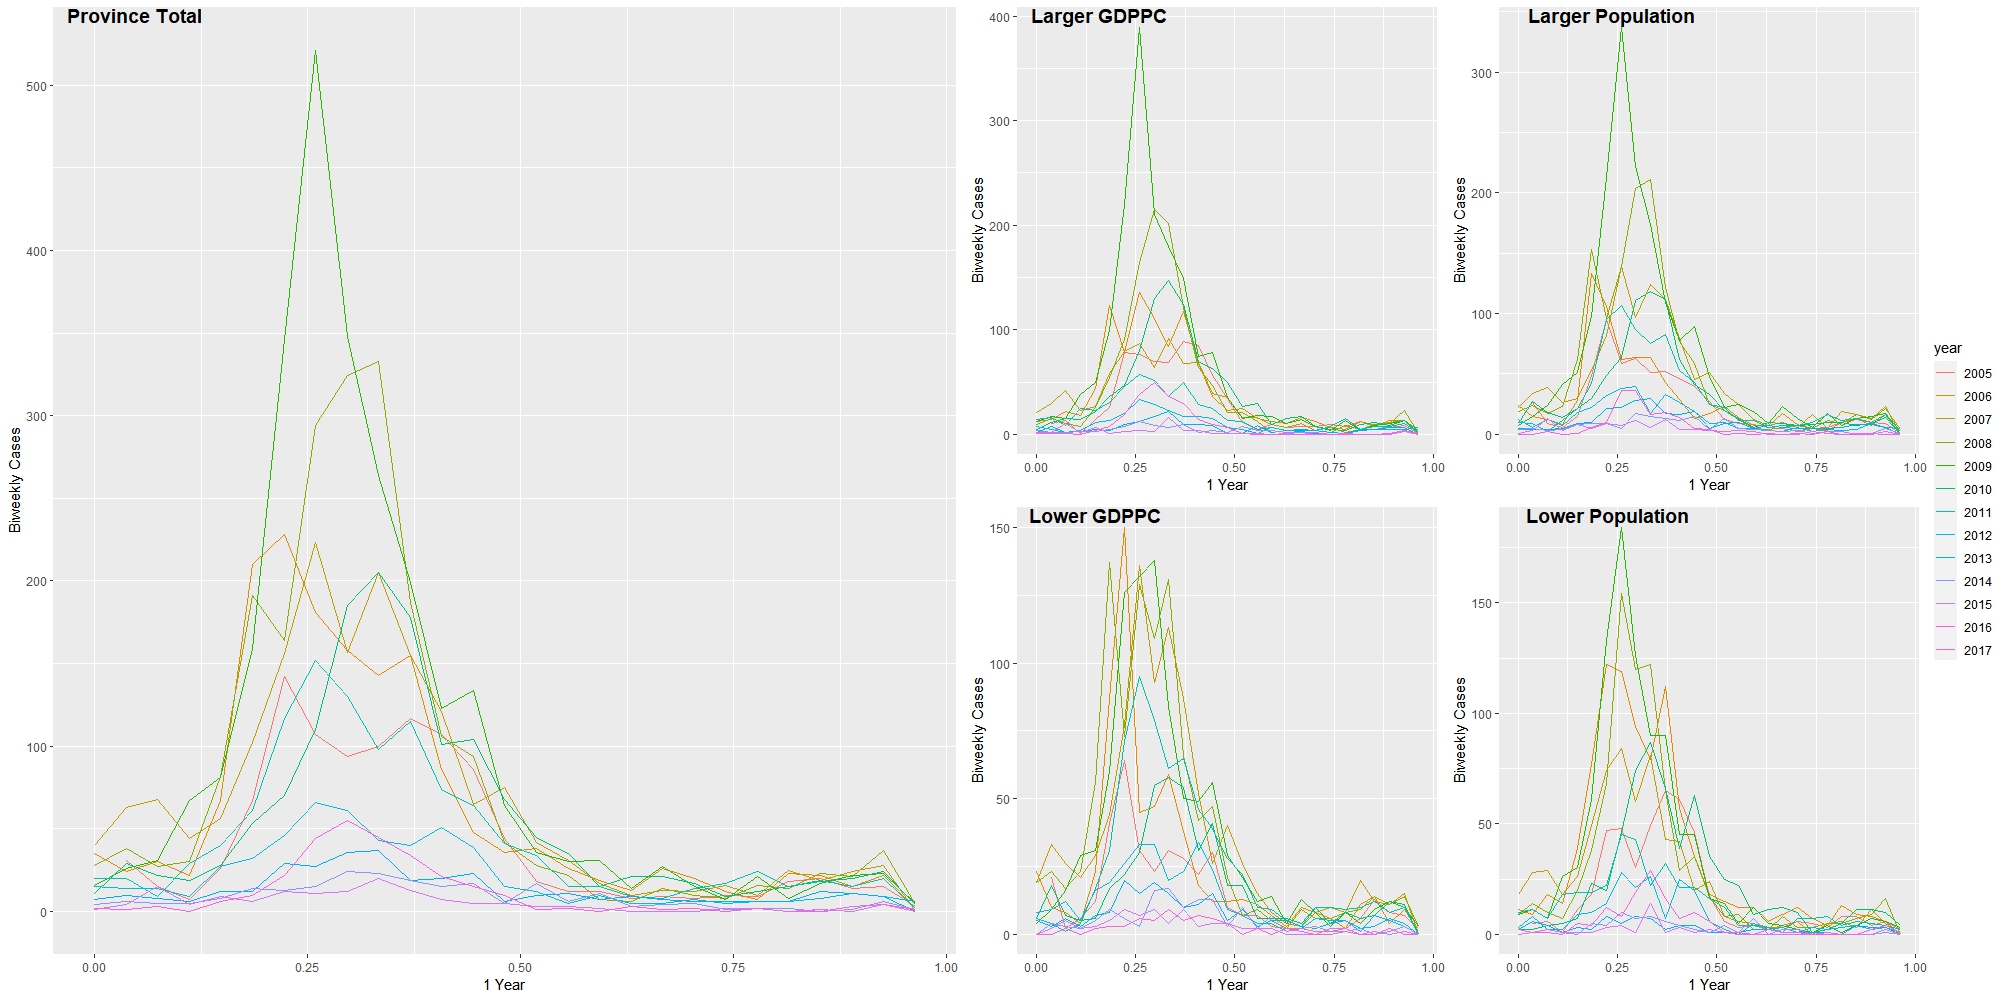
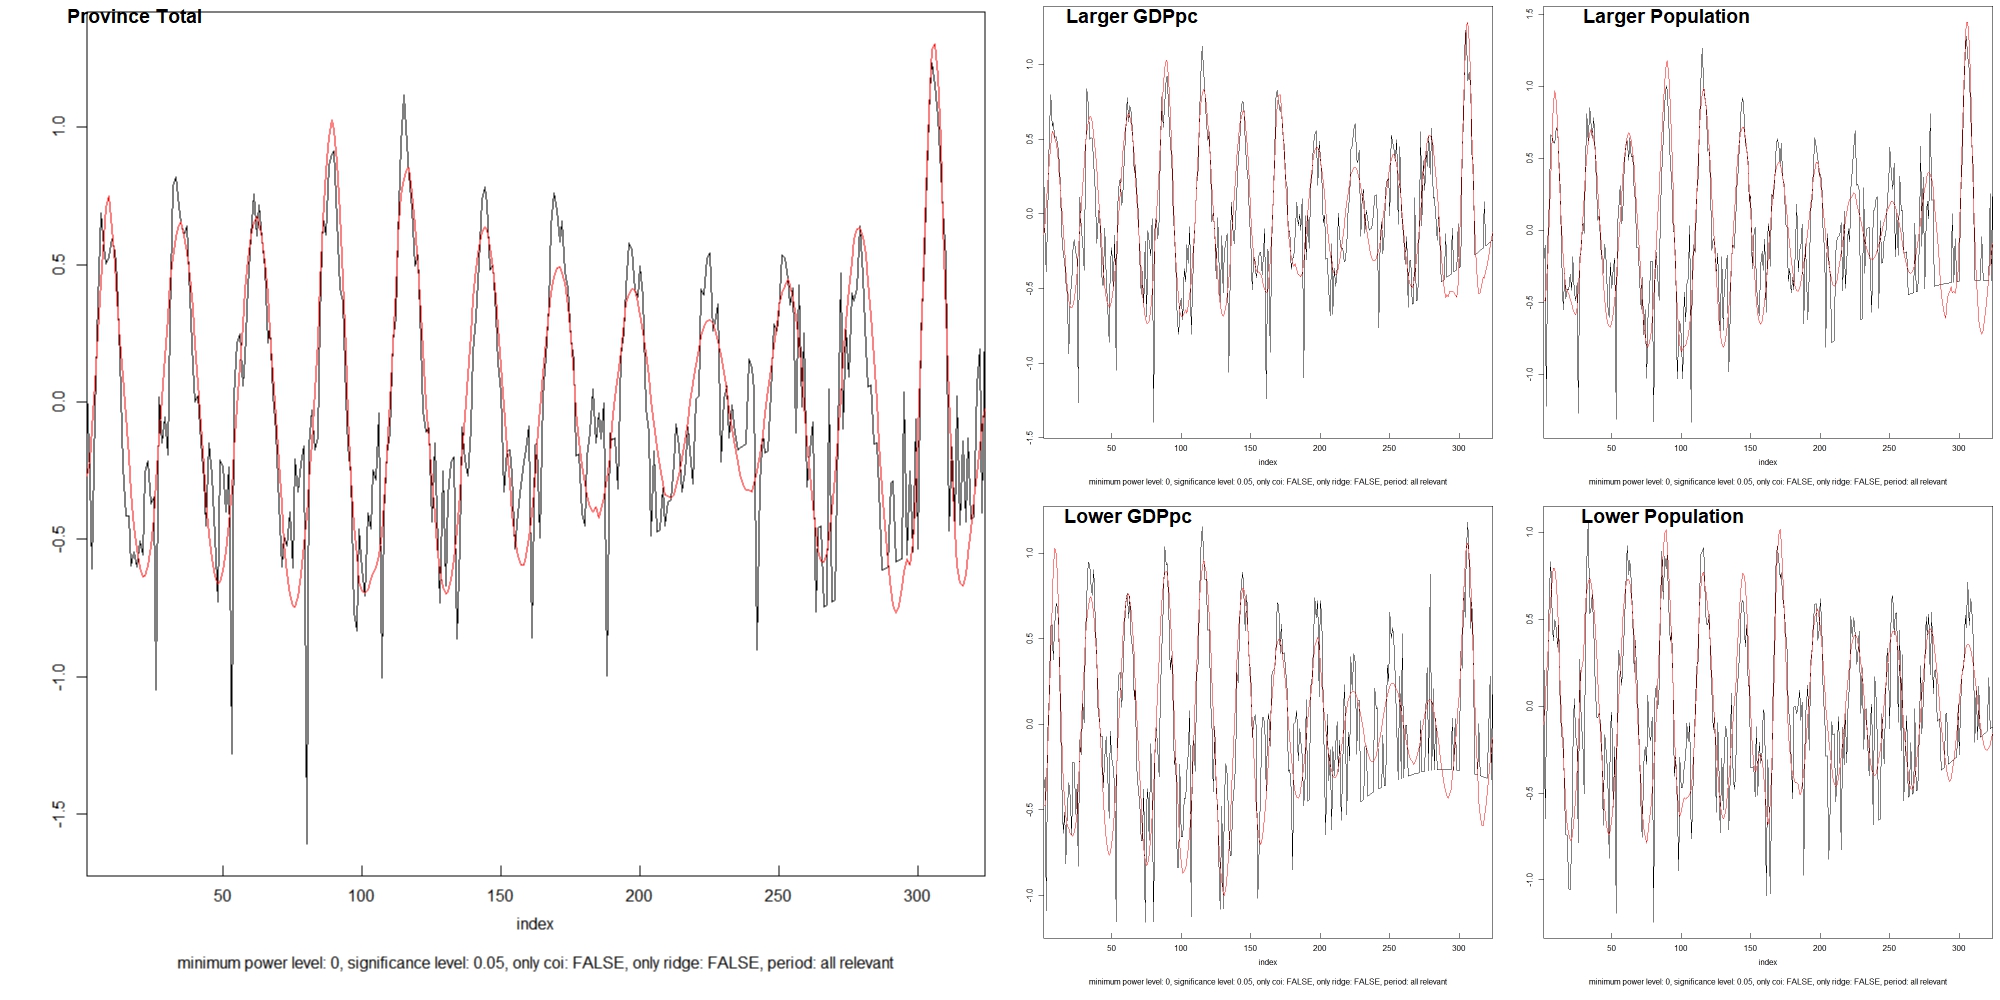
We can see that the amplitude of the case line was much lower in the years after 2015. However, the frequencies of the waves did not change obviously. The results of the wavelet analysis below could more precisely answer whether the frequencies are stable in different areas. The red part shows that all locations have a main annual wave (period ≈ 27 bi-weeks) of the case line and a relatively stable wave before 2014 (before bi-week 220) whose frequency is a little bit higher than the major one.
Discussion
In the results, we found that the association between per capita GDP and log of population size is statistically significant; the R0 is positively related with log population size but not related with per capita GDP of the county; per capita GDP was confounding and modifying the relationship between rubella random extinction proportion; counties with different population size and per capita GDP have similar frequencies of rubella outbreak which is about one year.
Unlike other areas in previous studies12-14, as a central area of a continental nation, districts in Henan province could be more similar to each other. Therefore, it is crucial when we want to define locations with different characteristics. Through the result, we would say that the per capita GDP and population size of counties in Henan province do not have a strong correlation that may impede us to put them together in the analysis. Although the result of model 1(Table 1.) shows that the regression coefficient for population size is statistically significant at 0.05 critical criteria, by given the mean range of per capita GDP for each county: (1.30, 5.51) and the same range of population size: (559611.6, 641956.1), we can see that the population size can only influence a little bit per capita GDP. Besides, the lowest or highest per capita GDP may not correspond to the lowest or highest population size. Additionally, by directly check the line plot of population size and per capita GDP of the random county subset, it should be clear that these two variables do not have strong collinearity.
The results of the odds ratio of the binary variables, on the other hand, shows a statistically significant negative association between per capita GDP and population size. The direction of this association is similar to the result of model 1. Since this result is based on the county level, we cannot know the pure relationship between the two variables for each county from this result. But this result may influence the tests which aggregate all records at different times for each county.
In the univariate analyses between R0 and different local status, we can see that the association between R0 as well as the basic reproduction number and locations’ population size is statistically significant. The R0 in cities whose population is larger than the median is 4.672 (95% CI: 2.75, 6.59) times higher than cities whose population is smaller than the median. This result shows that the scale of rubella outbreaks in districts with larger population sizes could also be larger. This is a good thing for relieving the burden of CRS. On the contrary, in locations where the R0 are always low, more susceptive people could grow up to the pregnant ages without antibodies. In the mixed model (model 5), we can see that the economic status won’t influence the relationship between population size and R0 a lot, and the relationship between economics status and R0 was still not statistically significant after controlling for the population status.
The relationship between the rubella random extinction proportion and population size still statistically significant based on the results in Table 3. The larger population in the area, the higher proportion of new cases covered in the time axis. Per capital GDP is also influencing the relationship both on the intercept and slope of the linear relationship. In richer areas, the disease seems more active that only need about one third times of poorer areas to be permanently exist in the population. This indicates a better vaccine coverage in the richer areas8. This result also shows that areas with lower per capita GDP and lower population size need more attention when preventing CRS. Because susceptible individuals are more likely accumulating in those areas with low virus activity. However, since the slopes of relationship between population size and random extinction proportion are also statistically related with each other, there is a cross point between two lines. Although the critical population size is larger, the basic extinction proportion in a very small population is lower in poorer areas.
There are no obvious differences in the seasonality analysis among areas with different properties. In all subsets and total dataset for Henan province, there is a strong signal whose period is about 1 year. It means the main structure of the case wave is a one-year-period curve. It could be estimated as the red line in Fig 6. This result is similar to the previous study in Peru13. Around 2008 to 2014 (bi-week 80 to bi-week 220), there is an obvious signal whose period is around 10 bi-weeks. It may relate to the vaccination and childbearing policies change in the province. This phenomenon is consistent in all subsets except areas where the population size is larger than the median. In those areas, the higher frequency signal was not that clear compare with other areas. It means that rubella transportation in large population areas is more stable.
Limitations
The population sizes and per capita GDPs may not be normally distributed for all counties. Therefore, using a regression approach to analyze the association between them may not be the most proper way. However, it is still better than a spearman correlation because the fixed effect model could eliminate the cross-sectional effect on the greatest extent.
The binary variables are created by cutting the continuous variable from the median point. This may hide the true association if there is a more natural cutting solution for the variables.
In the regression model that used to calculate critical community size. We did not made transforms of the dependent variable, which is the random extinction proportion. Therefore, based on that model, when population size is larger than the critical community size, the extinction proportion could be lower than 0. We also tried transform the dependent variable to log odds (ln(odds of extinction proportion)), but the model cannot fit the data very well and the approach we used is also used in the previous study of Peru13.
In this study, we only analyzed relationships between rubella dynamic measurements with two variables because of the lack of data sources. Thus, there could be many confounders or modifiers that may bias the true relationship.
The basic reproduction number could be more precisely calculated if we have the growth rate, birth number based on age group and the maternal immunity period of rubella in Henan province and current measurement is only a value that is in proportion to R0. Besides, because of the mild symptom of rubella, cases number are usually under reported33. If there are more mild cases in older age groups are reported, the result of R0 calculation could be smaller. In addition, the current result of R0 is based on all age groups. If we could have the birth number based on age group, we could calculate R0s for different age groups which is more crucial for preventing CRS.
The results in Henan province could be hard to represent other provinces in China. The population structure in Henan province is special. As we mentioned above, people in Henan province have higher mobility because of the special traffic position. Besides, different health policies like vaccination and infectious diseases report standards may differ in other provinces.
Conclusion
By looking into key measurements of infectious dynamics, this study shows that in Henan Province, China, the transmission of the rubella virus is related to population size, which is similar to studies in other countries. In areas with a larger population, the rubella cases show more frequently, which is a good thing for releasing the burden of CRS. Especially, the virus in large population areas shows more power of transmission ability which could be explained by the reproduction number. On the other hand, local economics do not influence the basic reproduction number and seasonality characteristics of the rubella virus obviously. But statistically influenced the relationship between population size and rubella random extinction proportion. Based on our results, the CRS preventing work should focus on areas with less population, where the rubella transmission is milder and could create susceptible people in older age groups.
Acknowledgment
Thanks for the data sharing from the Center for Disease Control and Prevention of Henan Province, China.
Reference
- Gregg NM. Congenital cataract following German measles in the mother. 1941. Epidemiol Infect. 1991;107(1):iii-xiv; discussion xiii-xiv.
- Anderson RM, Anderson B, May RM. Infectious diseases of humans: dynamics and control. Oxford university press; 1992.
- Plotkin SA. Rubella eradication. Vaccine. 2001;19(25-26):3311-3319.
- Banatvala JE, Brown DW. Rubella. The Lancet. 2004;363(9415):1127-1137.
- Best JM, Banatvala JE. Rubella. Principles and practice of clinical virology. 1999:387-418.
- Gao L, Hethcote H. Simulations of rubella vaccination strategies in China. Math Biosci. 2006;202(2):371-385.
- Anderson RM, May RM. Vaccination against rubella and measles: quantitative investigations of different policies. J Hyg (Lond). 1983;90(2):259-325.
- KNOX EG. Strategy for Rubella Vaccination. International Journal of Epidemiology. 1980;9(1):13-23.
- Anderson RM, Grenfell BT. Quantitative investigations of different vaccination policies for the control of congenital rubella syndrome (CRS) in the United Kingdom. J Hyg (Lond). 1986;96(2):305-333.
- Panagiotopoulos T, Antoniadou I, Valassi-Adam E. Increase in congenital rubella occurrence after immunisation in Greece: retrospective survey and systematic review. Bmj. 1999;319(7223):1462-1467.
- Vynnycky E, Gay NJ, Cutts FT. The predicted impact of private sector MMR vaccination on the burden of Congenital Rubella Syndrome. Vaccine. 2003;21(21-22):2708-2719.
- Metcalf CJ, Munayco CV, Chowell G, Grenfell BT, Bjornstad ON. Rubella metapopulation dynamics and importance of spatial coupling to the risk of congenital rubella syndrome in Peru. J R Soc Interface. 2011;8(56):369-376.
- Rios-Doria D, Chowell G, Munayco-Escate C, Witthembury A, Castillo-Chavez C. Spatial and temporal dynamics of rubella in Peru, 1997–2006: geographic patterns, age at infection and estimation of transmissibility. In: Mathematical and statistical estimation approaches in epidemiology. Springer; 2009:325-341.
- Metcalf CJ, Bjornstad ON, Ferrari MJ, et al. The epidemiology of rubella in Mexico: seasonality, stochasticity and regional variation. Epidemiol Infect. 2011;139(7):1029-1038.
- Cutts FT, Vynnycky E. Modelling the incidence of congenital rubella syndrome in developing countries. Int J Epidemiol. 1999;28(6):1176-1184.
- Wolfson LJ, Strebel PM, Gacic-Dobo M, Hoekstra EJ, McFarland JW, Hersh BS. Has the 2005 measles mortality reduction goal been achieved? A natural history modelling study. Lancet. 2007;369(9557):191-200.
- Dowdle WR, Ferrera W, De Salles Gomes LF, et al. WHO collaborative study on the sero-epidemiology of rubella in Caribbean and Middle and South American populations in 1968. Bull World Health Organ. 1970;42(3):419-422.
- Wannian S. Rubella in the People’s Republic of China. Clinical Infectious Diseases. 1985;7(Supplement_1):S72-S72.
- Hesketh T, Zhou X, Wang Y. The End of the One-Child Policy: Lasting Implications for China. Jama. 2015;314(24):2619-2620.
- McLean AR, Anderson RM. Measles in developing countries. Part I. Epidemiological parameters and patterns. Epidemiol Infect. 1988;100(1):111-133.
- Bartlett MS. Measles periodicity and community size. Journal of the Royal Statistical Society Series A (General). 1957;120(1):48-70.
- FINE PEM, CLARKSON JA. Seasonal Influences on Pertussis. International Journal of Epidemiology. 1986;15(2):237-247.
- Bauch CT, Earn DJ. Transients and attractors in epidemics. Proc Biol Sci. 2003;270(1524):1573-1578.
- Rozhnova G, Nunes A. Stochastic effects in a seasonally forced epidemic model. Phys Rev E Stat Nonlin Soft Matter Phys. 2010;82(4 Pt 1):041906.
- Wickham H, Wickham MH. Package ‘dplyr’. Obtenido de
- Wickham H, Hester J, Chang W, Hester MJ. Package ‘devtools’. 2019.
- Wilke CO, Wilke MCO. Package cowplot. Streamlined Plot Theme and Plot Annotations for ‘ggplot2. 2019.
- Pinheiro J, Bates D, DebRoy S, et al. Package ‘nlme’. Linear and nonlinear mixed effects models, version. 2017;3.
- Dragulescu AA, Dragulescu MAA, Provide R. Package ‘xlsx’. Cell. 2020;9:1.
- Wickham H, Chang W, Wickham MH. Package ‘ggplot2’. Create Elegant Data Visualisations Using the Grammar of Graphics Version. 2016;2(1):1-189.
- Roesch A, Schmidbauer H, Roesch MA. Package ‘WaveletComp’. The Comprehensive R Archive Network2014. 2014.
- stargazer: Well-Formatted Regression and Summary Statistics Tables [computer program]. 2018.
- Finkenstädt BF, Grenfell BT. Time series modelling of childhood diseases: a dynamical systems approach. Journal of the Royal Statistical Society: Series C (Applied Statistics). 2000;49(2):187-205.