
Course assignment of EPID 622
Author: Ruoyan Han
Exploring Association Between Self-Reported Mental Health and Obesity by Using Propensity Score to Adjust Chronic Diseases
Introduction
Obesity is a risk factor for many significant morbidity1. The burden has been increasing since 1990 but still does not have a slowing down trend2,3. Up to now, in the United States, the burdens of obesity have been increasing and reached about 20% to 30% in different states4. On the other hand, there are many risk factors for obesity. One major risk factor of obesity claims by previous studies is mental health status. People who have mental illnesses could have 2
to 3 times risk of having obesity5. We will discuss the relationship between obesity and mental status in this paper.
Controlling for confounders is a normal considering when we want to measure the relationship between to conditions, and so do this time. There are also confounders between obesity and mental status. Both obesity and mental status are related to many chronic diseases. Hypertension, Dyslipidemia, and Diabetes1. Hypothyroidism6-8, Cushing’s Syndrome9,10, and polycystic Ovary Syndrome11 could cause a weight change of their patients. Besides, some drugs like Antidepressants12, Antipsychotics13, Sulfonylureas14, Thiazolidinediones14, Insulin14, Antiepileptic drugs15, Corticosteroids14 and Beta-blockers14 which are used to cure mental diseases, diabetes, hypertension, epilepsy, cardiovascular diseases, and autoimmune diseases can also cause a weight change. In another direction, chronic conditions have also been proved as a risk factor of mental illnesses16,17. Therefore, to have an accurate estimation of the relationship between mental status and obesity, we need to adjust to chronic diseases as confounders.
However, there is a problem between these confounders. Chronic diseases are usually related to each other. Some typical examples are diabetes and hypertension18; diabetes and asthma19; hypertension and kidney failure20, etc. If covariates are not independent with each other, it will influence the accuracy of the coefficient parameter21. The classical process would choose to
use stepwise strategy and remove co-linear items22 which could lose usage of collected data.
Propensity score23 is an approach that could help with the co-linearity covariates without eliminating them out of the data analysis24,25. The propensity score is the predicted probability for individuals in the dataset of being exposed by giving confounding values. One way to utilize the score is to adjust for the covariates. In observational studies, individuals are typically clustered into different exposure groups with different probabilities, where the
confounding can occur. Therefore, by controlling for the propensity score, confounders can also be adjusted23.
In this study, regression models would be fitted to test on what extent that propensity score could enhance the relationship estimation between self-reported mental status and obesity. Based on previous studies, we expected that the adjusted relationship would be positive, which means people with poorer mental status could have more chances to get obese.
Method
Data
Dataset of NYC HANES 2014-2014 (New York City Health and Nutrition Examination Survey)26 was used in the analyses. The dataset includes participants from households who live in five boroughs, over 20 years old, and non-institutionalized. There were two layers in the sampling strategy of this dataset. In the first layer, NYC was geologically recognized as 6236 segments
and 144 segments are randomly picked. In the selected segments, 0 to 2 household adults were randomly selected based on how many eligible adults are living in the houses within the 144 segments. The reason to select by houses is to minimize the household-to-household clustering. The total response rate was 36%. 1524 participants finished the survey.
Several variables in the NYC HANES dataset were used in this analysis:
‘Self-reported mental condition (MHQ_1)’ was chosen as the interested exposure. It is a 5-categories choice question. In some of our analysis, we transformed it into a binary variable by whether the self-reported mental status is ‘poor’ or not. ‘Body Mass Index (BMI)’ is a measurement that already generated in the dataset. The outcome variable in this analysis ‘whether obese’ was created based on this variable. If one participant’s BMI was over 30, he would be marked as ‘obese’. Five chronic diseases covariates were considered in the analysis:
‘whether having high blood pressure (BPQ_2), ‘whether having diabetes or sugar diabetes (DIQ_1)’, ‘whether having cancer or malignancy (MCQ_14)’, ‘whether having asthma (MCQ_1)’ and ‘whether having failing kidneys (MCQ_12)’. Besides, six mental health questions (MHQ_2 to MHQ_7) were used for validity tests. Age and Gender were used as common confounder and modifier. (Details of questions and items used in this analysis would be added to the appendix.)
Cronbach alpha
To check the validity of the outcome variables, self-reported mental health, Cronbach alphas are calculated. There are seven questions (MHQ1 - MHQ7) that asked all participants about their mental mood. The first question was picked as the outcome. Cronbach alpha is calculated based on the answers of the seven questions to see whether they have a good consistency. During data processing, we re-coded question MHQ-1 to let it have the same direction with the other six
questions of representing mental status from better to worse rather than from worse to better.
Weighting Sample
Two parts of the survey results were covered in our analyses: computer interview and physical tests, which correspond to two weights in the dataset (CAPI_WT and EXAM_WT). The sample size of the computer interview is 1,527 and the sample size of the physical tests is 1500. In the regression analyses, participants with missing data are removed. Therefore, the weight of the physical tests, which have lower samples, was used to adjusting in the models.
Univariate Analysis and Multivariate Analysis
In the univariate analysis part, to comparing regression coefficients of the chronic diseases, we also added age and gender into the models:
(model 1)
(model 2)
(model 3)
(model 4)
(model 5)
(model 6)
Multivariable regression model included all covariates in the univariate
analysis:
(model 7)
Logistic regression with Propensity Score
The propensity score is the estimated probability of exposure based on
covariates, which could be measured with the following model:
(model 8)
After the score is calculated, we could remove the original covariates and
replace them with the score:
(model 9)
Tools
All data processing and analysis are finished in SAS 9.4.
Results
Descriptive Analysis
Table 1. Covariates Distribution Among Different Outcome Status
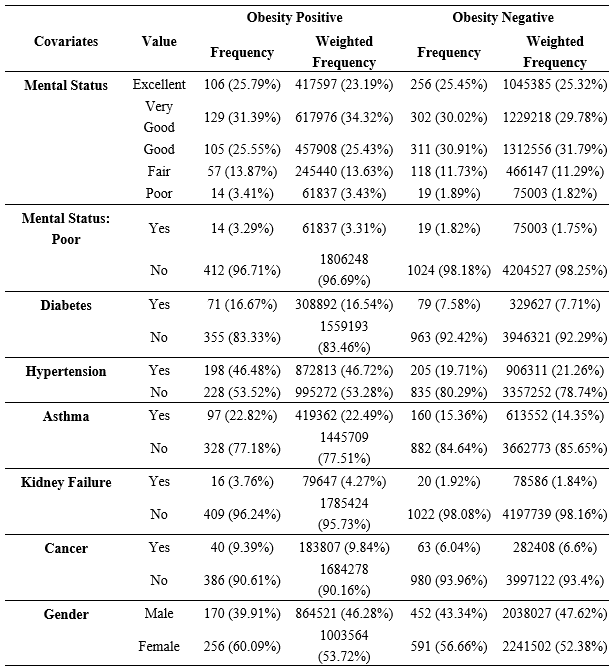
This table shows the distribution of covariates that include in the analyses among participants with different obesity status. ‘Mental Status: Poor’, which is the binary-transformed variable from ‘Mental Status’ is the exposure variable in the following analyses.
Questionnaire Validity
We calculated the Cronbach alpha for seven mental questions that asked all participants (MHQ_1 to MHQ_7). The alpha of answers to the seven questions is over 0.8, which indicates that they have a high consistency. Any banning of the variables could cause a reduction of the alpha value.
Table 2. Cronbach Alpha for Mental Status Questions
| Question | Alpha after banned this question |
|---|---|
| Mental Status Level (Excellent/ Very Good/ Good/ Fair/ Poor) | 0.84 |
| Past 30 days, felt nervous level (All/ Most/ Some/ A little/ None of the time) | 0.84 |
| Past 30 days, felt hopeless or not (All/ Most/ Some/ A little/ None of the time) | 0.82 |
| Past 30 days, felt restless or fidgety or not (All/ Most/ Some/ A little/ None of the time) | 0.83 |
| Past 30 days, felt depressed, no cheerin or not (All/ Most/ Some/ A little/ None of the time) | 0.82 |
| Past 30 days, felt everything an effort or not (All/ Most/ Some/ A little/ None of the time) | 0.83 |
| Past 30 days, felt worthless or not (All/ Most/ Some/ A little/ None of the time) | 0.82 |
| Total Alpha | 0.85 |
Classical Regression Analysis
Table 3 shows the result of univariate analysis and multivariable regression. Parameter of diabetes and kidney failure have obvious changes between the univariate model and the multivariate model. Other covariates and exposure did not change a lot in the multivariate model. P-value of exposure increased.
Regression with Propensity Score
The propensity score, which means the probability of exposure estimated by confounders, is fitted for each individual with a logistic regression model. Table 3 compares how the regression coefficient of self-reported mental status change between classical regression and regression using the propensity score.
To have a better view of natural log odds distribution under 5 original different self-reported status, two regression models with ordinal exposure degree were fitted and shown in Table 4.
Table 3. Regression models for the relationship between Self-reported Mental Status and Obese
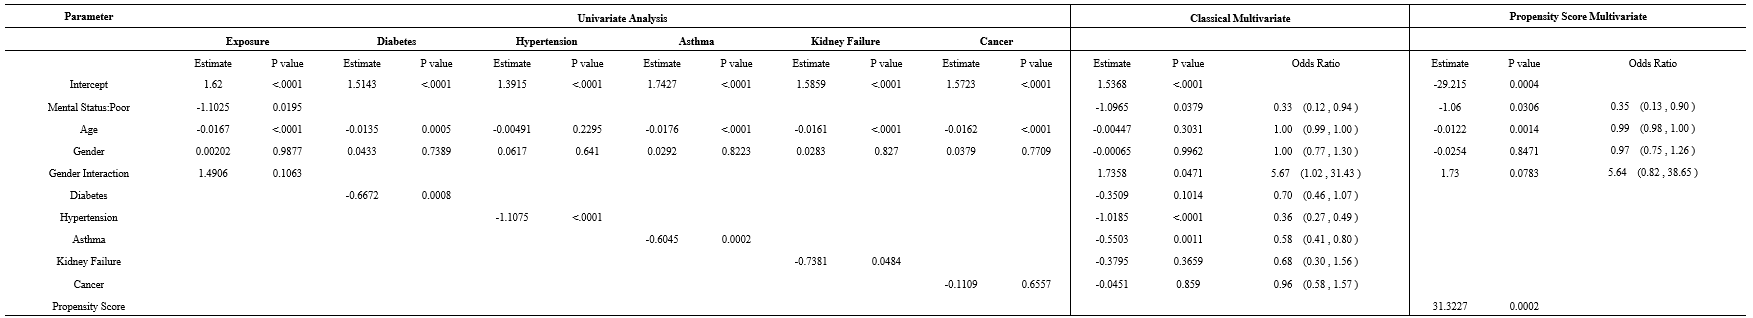
Table 4. Regression with Five-Degree Exposure
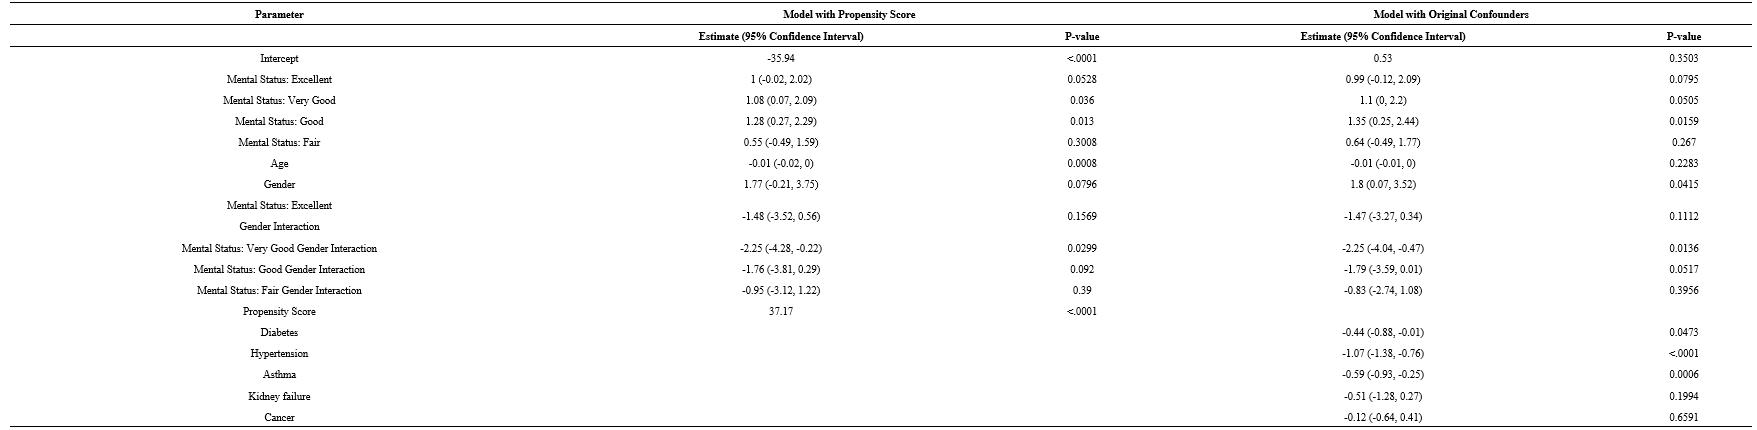
Note: The reference category of exposure was mental status equal to “poor”.
Discussion
The validity of the exposure question.
Since the exposure in this study is the self-reported mental status. The validity of this question needed to be checked. From the Cronbach’s alpha in Table 2, we can see that the total alpha of the questions was over 0.8, which means the consistency of these questions was high and they were not results that participants randomly made. Besides, by removing any of the questions, the total alpha would reduce, which means the answers to these questions were unique.
Relationship between self-reported mental status and obesity.
The result from regressions with original confounders and propensity scores in Table 3 are similar. The odds of being obese is lower among people whose self-reported mental health status is ‘poor’. Results in Table 4 indicate that this relationship is becoming stronger when the self-reported mental status is lower. In models using the propensity score, this relationship is confounded by age, older people have less chance of being obese, which is opposite to the initial hypothesis from the literature review. We can also reject the hypothesis that this relationship is not modified by gender on 0.05 critical criteria. By controlling for other covariates, the natural log odds of obese males are 1.75 higher than females. The model also showed the confounding effect of hypertension and asthma. People with these chronic diseases could have lesser odds of being obese.
However, the causal property is hard to extract from the results. Firstly, the NYC HANES is a cross-sectional survey that does not have temporal order in different variables. Secondly, the causal direction, in this case, is unclear. To illustrate the causal pathway, a cohort study would a better design.
Effect of using propensity score approach in regression.
The regression coefficient of exposure did not change a lot in models with propensity score. However, since the standard error of the parameter reduced a little bit, the p-value was also reduced. By comparing the regression parameter of chronic diseases from univariate analysis to multivariable analysis, we can notice that some chronic disease changed their regression coefficient and p-values like diabetes and kidney failure, this means these chronic diseases are actually related to each other. Besides, the regression coefficient and p-value of age as a confounder also changed in the model with propensity score, which could reduce biases from chronic diseases.
Limitation
The propensity score was not showing its power in this case obviously. By using the propensity score approach to control for confounders, it can also resolve two problems other than correlations between confounders: the unacceptably large number of covariates and unknown confounders. If we could have more records about chronic disease, the difference between classical multivariable analysis and regression with propensity score could be more obvious.
Besides, the number of exposed individuals was relatively low in this analysis. It could influence the power of the analyses which needs to be concerned if the result were not statistically significant. And it may also reduce the precision of our results.
Conclusion
Among people who live in New York city and older than 20 years old and have ‘poor’ self-reported mental status is negatively related to obesity. By controlling for age and chronic diseases, the odds of being obese for people whose self-reported mental status is ‘poor’ is 0.35 (95%CI: 0.13, 0.93) times than other people.
The propensity score approach in this analysis did not improve the model obviously.
Reference:
Heart N, Lung, Institute B, Diabetes NIo, Digestive, Diseases K. Clinical
guidelines on the identification, evaluation, and treatment of overweight and
obesity in adults: the evidence report. National Heart, Lung, and Blood
Institute; 1998.STATEofCHILDHOODOBESITY. Adult Obesity Rates.
In:2018:https://stateofchildhoodobesity.org/adult-obesity/.Behavioral Risk Factor Surveillance System Survey Data. 2018.
Prevention CfDCa. Adult Obesity Prevalence Maps.
https://www.cdc.gov/obesity/data/prevalence-maps.html#overall. Published 2018.
Accessed May.10.2020, 2020.Avila C, Holloway AC, Hahn MK, et al. An Overview of Links Between Obesity
and Mental Health. Curr Obes Rep. 2015;4(3):303-310.Pearce EN. Thyroid hormone and obesity. Curr Opin Endocrinol Diabetes Obes.
2012;19(5):408-413.Kitahara CM, Platz EA, Ladenson PW, Mondul AM, Menke A, Berrington de
Gonzalez A. Body fatness and markers of thyroid function among U.S. men and
women. PLoS One. 2012;7(4):e34979.Laurberg P, Knudsen N, Andersen S, Carlé A, Pedersen IB, Karmisholt J.
Thyroid function and obesity. Eur Thyroid J. 2012;1(3):159-167.Kirk LF, Jr., Hash RB, Katner HP, Jones T. Cushing’s disease: clinical
manifestations and diagnostic evaluation. Am Fam Physician.
2000;62(5):1119-1127, 1133-1114.Tiryakioglu O, Ugurlu S, Yalin S, et al. Screening for Cushing’s syndrome in
obese patients. Clinics (Sao Paulo). 2010;65(1):9-13.Legro RS, Arslanian SA, Ehrmann DA, et al. Diagnosis and treatment of
polycystic ovary syndrome: an Endocrine Society clinical practice guideline. J
Clin Endocrinol Metab. 2013;98(12):4565-4592.Uguz F, Sahingoz M, Gungor B, Aksoy F, Askin R. Weight gain and associated
factors in patients using newer antidepressant drugs. Gen Hosp Psychiatry.
2015;37(1):46-48.Galling B, Calsina Ferrer A, Abi Zeid Daou M, Sangroula D, Hagi K, Correll
CU. Safety and tolerability of antidepressant co-treatment in acute major
depressive disorder: results from a systematic review and exploratory
meta-analysis. Expert Opin Drug Saf. 2015;14(10):1587-1608.Velazquez A, Apovian CM. Pharmacological management of obesity. Minerva
Endocrinol. 2018;43(3):356-366.Ness-Abramof R, Apovian CM. Drug-induced weight gain. Drugs Today (Barc).
2005;41(8):547-555.Brown HK, Qazilbash A, Rahim N, Dennis CL, Vigod SN. Chronic Medical
Conditions and Peripartum Mental Illness: A Systematic Review and Meta-Analysis.
Am J Epidemiol. 2018;187(9):2060-2068.Brown HK, Wilton AS, Ray JG, Dennis CL, Guttmann A, Vigod SN. Chronic
physical conditions and risk for perinatal mental illness: A population-based
retrospective cohort study. PLoS Med. 2019;16(8):e1002864.Krzesinski JM, Weekers L. [Hypertension and diabetes]. Rev Med Liege.
2005;60(5-6):572-577.Baek JY, Lee SE, Han K, Koh EH. Association between diabetes and asthma:
Evidence from a nationwide Korean study. Ann Allergy Asthma Immunol.
2018;121(6):699-703.Gargiulo R, Suhail F, Lerma EV. Hypertension and chronic kidney disease.
Dis Mon. 2015;61(9):387-395.Wold S, Ruhe A, Wold H, Dunn I, WJ. The collinearity problem in linear
regression. The partial least squares (PLS) approach to generalized inverses.
SIAM Journal on Scientific and Statistical Computing. 1984;5(3):735-743.Weitzen S, Lapane KL, Toledano AY, Hume AL, Mor V. Principles for modeling
propensity scores in medical research: a systematic literature review.
Pharmacoepidemiology and drug safety. 2004;13(12):841-853.Haukoos JS, Lewis RJ. The Propensity Score. Jama. 2015;314(15):1637-1638.
Rosenbaum PR, Rubin DB. The central role of the propensity score in
observational studies for causal effects. Biometrika. 1983;70(1):41-55.D’Agostino Jr RB. Propensity score methods for bias reduction in the
comparison of a treatment to a non‐randomized control group. Statistics in
medicine. 1998;17(19):2265-2281.Perlman SE, Charon Gwynn R, Greene CM, Freeman A, Chernov C, Thorpe LE. NYC
HANES 2013-14 and Reflections on Future Population Health Surveillance. J Urban
Health. 2018;95(6):777-780.
Appendix:
Questions used in the analysis:
MHQ_1
Now thinking about your mental health, which includes stress, depression and
emotional problems, would you say your overall mental health is excellent, very
good, good, fair, or poor?
1: Excellent
2: Very good
3: Good
4: Fair
5: Poor
.D: Don’t know
.R: Refusal
.: Legit skip
MHQ_2
During the past 30 days, how often did you feel nervous?
1: All of the time
2: Most of the time
3: Some of the time
4: A little of the time
5: None of the time
.D: Don’t know
.R: Refusal
.: Legit skip
MHQ_3
During the past 30 days, how often did you feel hopeless?
1: All of the time
2: Most of the time
3: Some of the time
4: A little of the time
5: None of the time
.D: Don’t know
.R: Refusal
.: Legit skip
MHQ_4
During the past 30 days, how often did you feel restless or fidgety?
1: All of the time
2: Most of the time
3: Some of the time
4: A little of the time
5: None of the time
.D: Don’t know
.R: Refusal
.: Legit skip
MHQ_5
During the past 30 days, how often did you feel so sad or depressed that nothing
could cheer you up?
1: All of the time
2: Most of the time
3: Some of the time
4: A little of the time
5: None of the time
.D: Don’t know
.R: Refusal
.: Legit skip
MHQ_6
During the past 30 days, how often did you feel that everything was an effort?
1: All of the time
2: Most of the time
3: Some of the time
4: A little of the time
5: None of the time
.D: Don’t know
.R: Refusal
.: Legit skip
MHQ_7
During the past 30 days, how often did you feel down on yourself, no good or
worthless?
1: All of the time
2: Most of the time
3: Some of the time
4: A little of the time
5: None of the time
.D: Don’t know
.R: Refusal
.: Legit skip
BPQ_2
Has SP ever been told by a doctor or other health professional that SP had
hypertension, also called high blood pressure?
1: Yes
2: No
.D: Don’t know
DIQ_1
(Other than during pregnancy, ) Has SP ever been told by a doctor or health
professional that SP has diabetes or sugar diabetes?
1: Yes
2: No
3: Borderline or Prediabetes
.D: Don’t know
MCQ_1
Has a doctor or other health professional ever told SP that (you have/s/he/SP
has) asthma?
1: Yes
2: No
MCQ_12
Has SP ever been told by a doctor or other health professional that SP had weak
or failing kidneys? Do not include kidney stones, bladder infections, or
incontinence.
1: Yes
2: No
.D: Don’t know
MCQ_14
Has SP ever been told by a doctor or other health professional that SP had
cancer or a malignancy of any kind?
1: Yes
2: No